# load packages
library(tidyverse)
library(survival)
library(marginaleffects)

# load data
cancer <- survival::cancer |>
  glimpse()
Rows: 228
Columns: 10
$ inst <dbl> 3, 3, 3, 5, 1, 12, 7, 11, 1, 7, 6, 16, 11, 21, 12, 1, 22, 16…
$ time <dbl> 306, 455, 1010, 210, 883, 1022, 310, 361, 218, 166, 170, 654…
$ status <dbl> 2, 2, 1, 2, 2, 1, 2, 2, 2, 2, 2, 2, 2, 2, 2, 2, 2, 2, 2, 2, …
$ age <dbl> 74, 68, 56, 57, 60, 74, 68, 71, 53, 61, 57, 68, 68, 60, 57, …
$ sex <dbl> 1, 1, 1, 1, 1, 1, 2, 2, 1, 1, 1, 2, 2, 1, 1, 1, 1, 1, 2, 1, …
$ ph.ecog <dbl> 1, 0, 0, 1, 0, 1, 2, 2, 1, 2, 1, 2, 1, NA, 1, 1, 1, 2, 2, 1,…
$ ph.karno <dbl> 90, 90, 90, 90, 100, 50, 70, 60, 70, 70, 80, 70, 90, 60, 80,…
$ pat.karno <dbl> 100, 90, 90, 60, 90, 80, 60, 80, 80, 70, 80, 70, 90, 70, 70,…
$ meal.cal <dbl> 1175, 1225, NA, 1150, NA, 513, 384, 538, 825, 271, 1025, NA,…
$ wt.loss <dbl> NA, 15, 15, 11, 0, 0, 10, 1, 16, 34, 27, 23, 5, 32, 60, 15, …# fit cox model
f <- Surv(time, status) ~ age + sex + pat.karno
fit <- coxph(f, data = cancer)
summary(fit)Call:
coxph(formula = f, data = cancer)
n= 225, number of events= 162
(3 observations deleted due to missingness)
coef exp(coef) se(coef) z Pr(>|z|)
age 0.011793 1.011863 0.009331 1.264 0.206269
sex -0.519262 0.594959 0.168967 -3.073 0.002118 **
pat.karno -0.019061 0.981120 0.005638 -3.381 0.000722 ***
---
Signif. codes: 0 '***' 0.001 '**' 0.01 '*' 0.05 '.' 0.1 ' ' 1
exp(coef) exp(-coef) lower .95 upper .95
age 1.0119 0.9883 0.9935 1.0305
sex 0.5950 1.6808 0.4272 0.8285
pat.karno 0.9811 1.0192 0.9703 0.9920
Concordance= 0.639 (se = 0.025 )
Likelihood ratio test= 24.33 on 3 df, p=2e-05
Wald test = 23.72 on 3 df, p=3e-05
Score (logrank) test = 24.23 on 3 df, p=2e-05# generate predictions
p <- predictions(
fit,
variables = list(time = unique, pat.karno = c(50, 100)),
newdata = datagrid(grid_type = "mean_or_mode"),
type = "survival" # <---- this is important!
)
ggplot(p, aes(x = time,
y = estimate,
ymax = conf.high,
ymin = conf.low)) +
geom_ribbon(fill = "grey80") +
geom_line() +
facet_wrap(vars(pat.karno))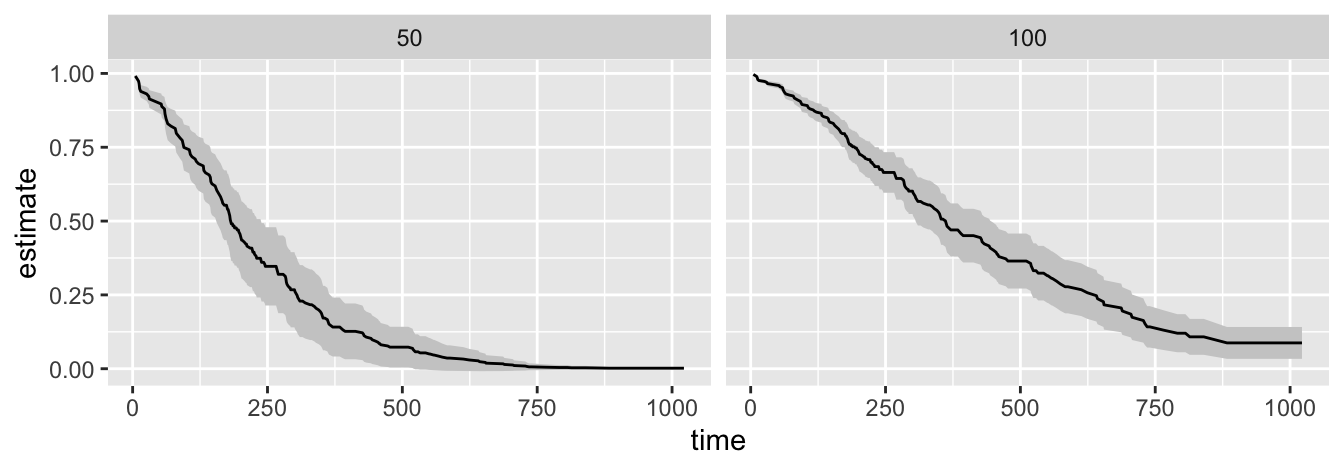
# generate comparisons
c <- comparisons(
  fit,
  variables = list(pat.karno = c(50, 100)),
  newdata = datagrid(time = unique),
  type = "survival"
  )
ggplot(c, aes(x = time,
              y = estimate,
              ymax = conf.high,
              ymin = conf.low)) +
  geom_ribbon(fill = "grey80") +
  geom_line()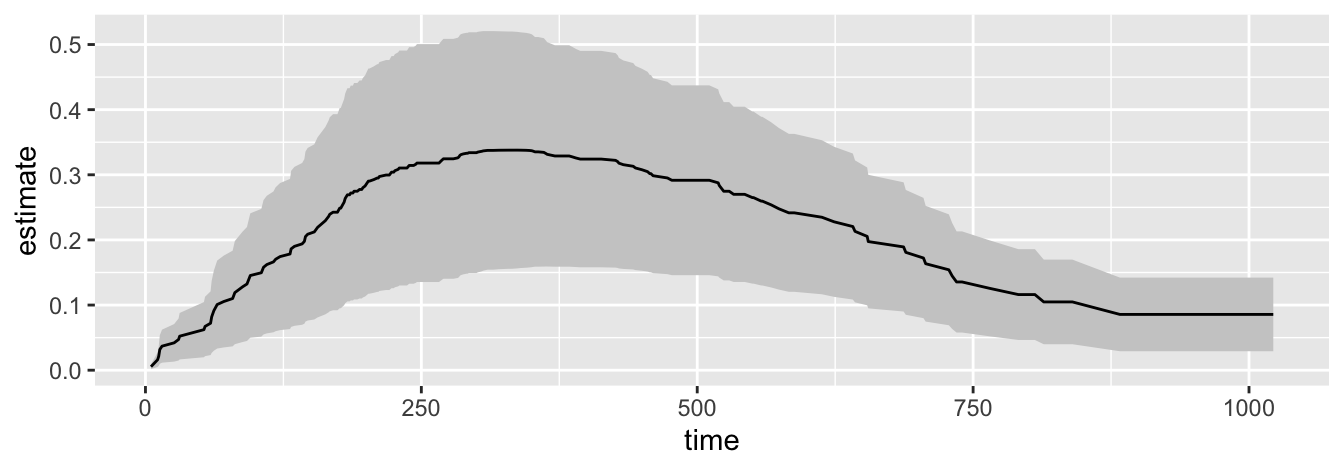
Comments on Tools
Be aware that some RIBC students might use RStudio via Posit Cloud rather than locally.